As we kick off the new year, we’re diving straight into an examination of 10-year yield seasonality and possible patterns which could play out based on if the 10-year is higher or lower come Spring time. It’s an opportune moment to explore annual patterns and trends in the financial landscape as we begin a fresh year. And, of course, we extend our warm wishes for a Happy New Year to all our readers.
First, let’s take a look at how seasonality played out last year. The blue line shows the path of the 10-year yield against the historical 60 year seasonal (grey).
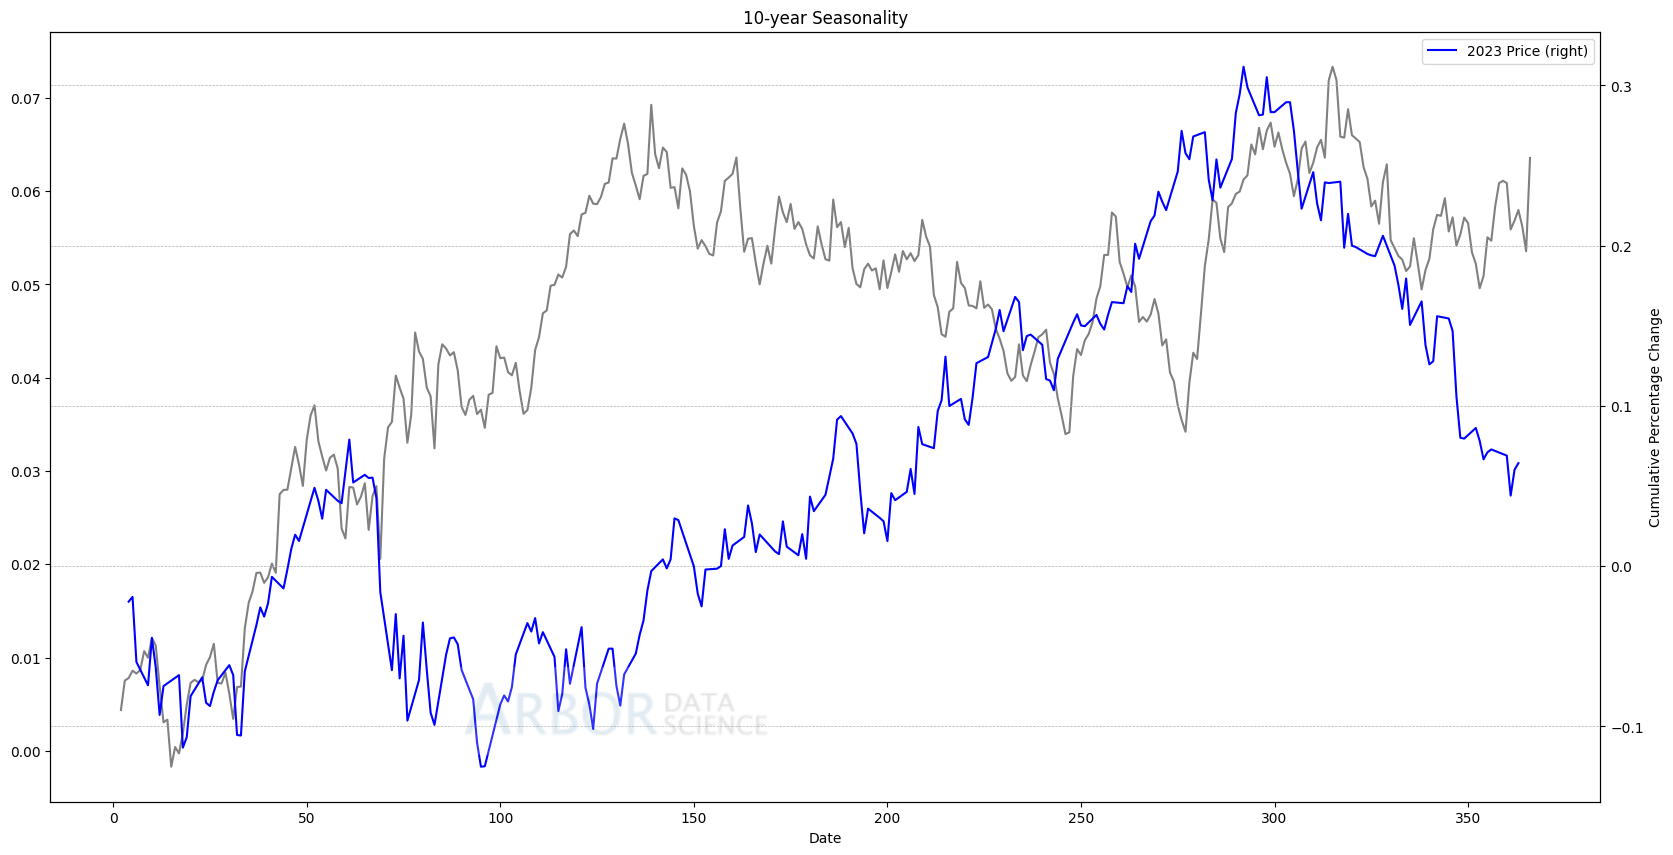
From the above chart, we can examine that despite a variety of geopolitical variables which swayed interest rates significantly last year, there were two notable periods where seasonality seemed to matter the most: the start of the year and the end.
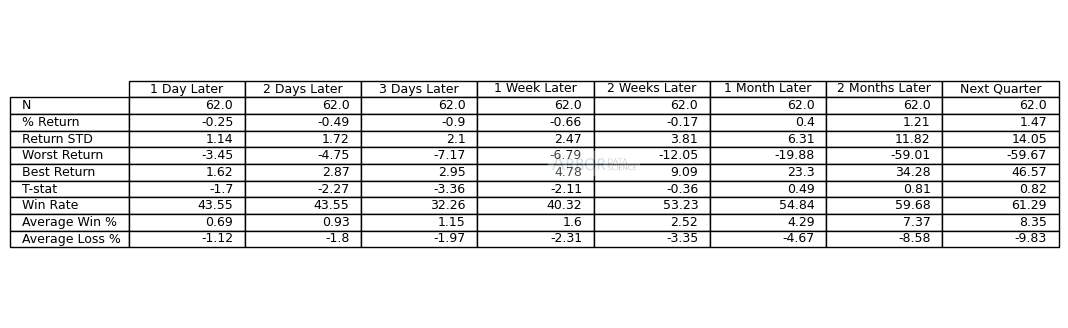
Typically, we can see that rates have a tendency to decrease at the start of the year and then finish strong into the second quarter. The above table denotes the 62 times (N) of each year’s trend for each time period forward.
In fact, if we do some ‘war-planning’ and let’s say that rates were lower in the first two months of the year, they are typically higher into the summer almost 70% of the time. This has happened 80 times since 1960 where in the first 2 months at some point, rates were lower from the start of the year.
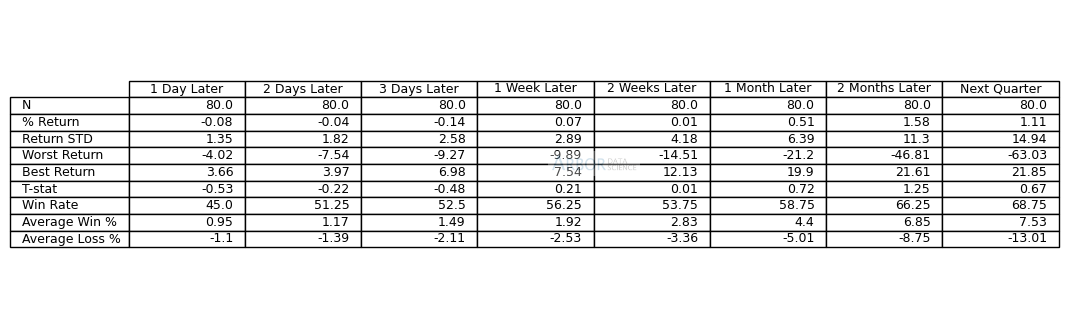
If we perform the opposite analysis: if rates are higher in the first two months, there is not a statistically significant verdict on where rates might end up.
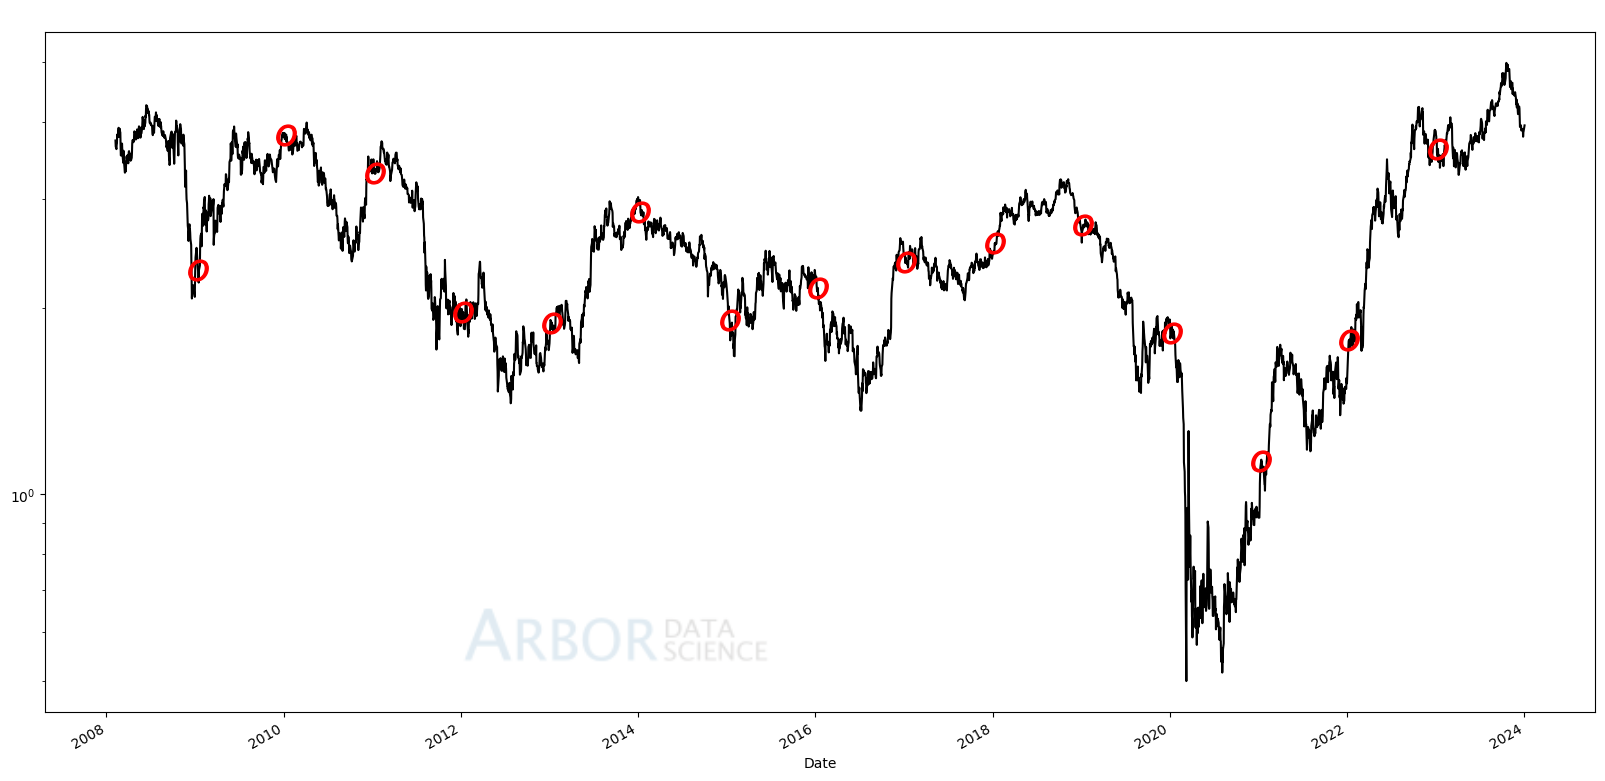
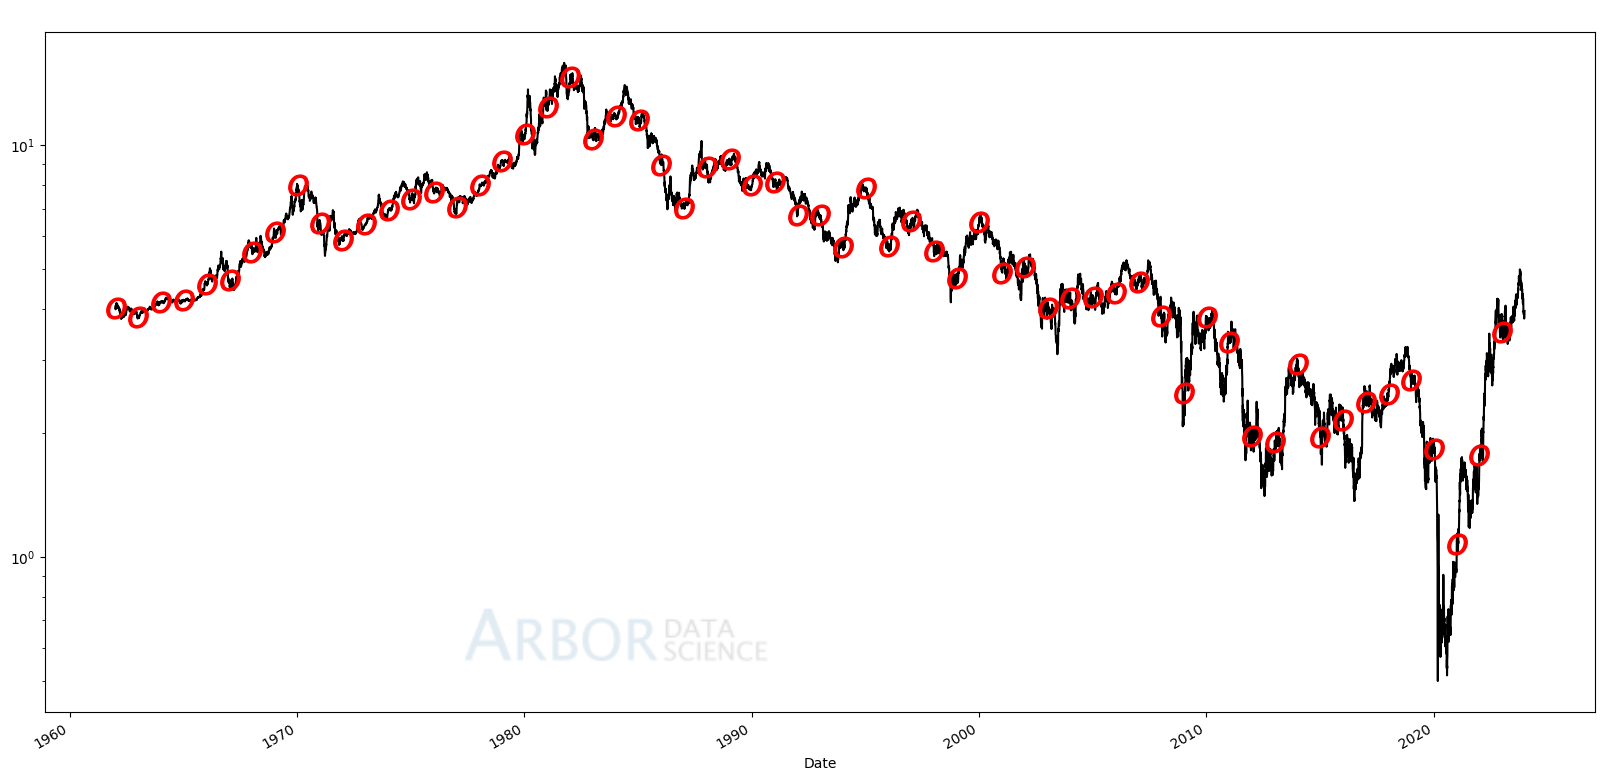
For context, the below chart gives us a red circle around the start of the year against the entire 10-year yield since 2008 and the 1960, respectively. Since Covid, the trend for kicking the year off has been rather strong for rates.
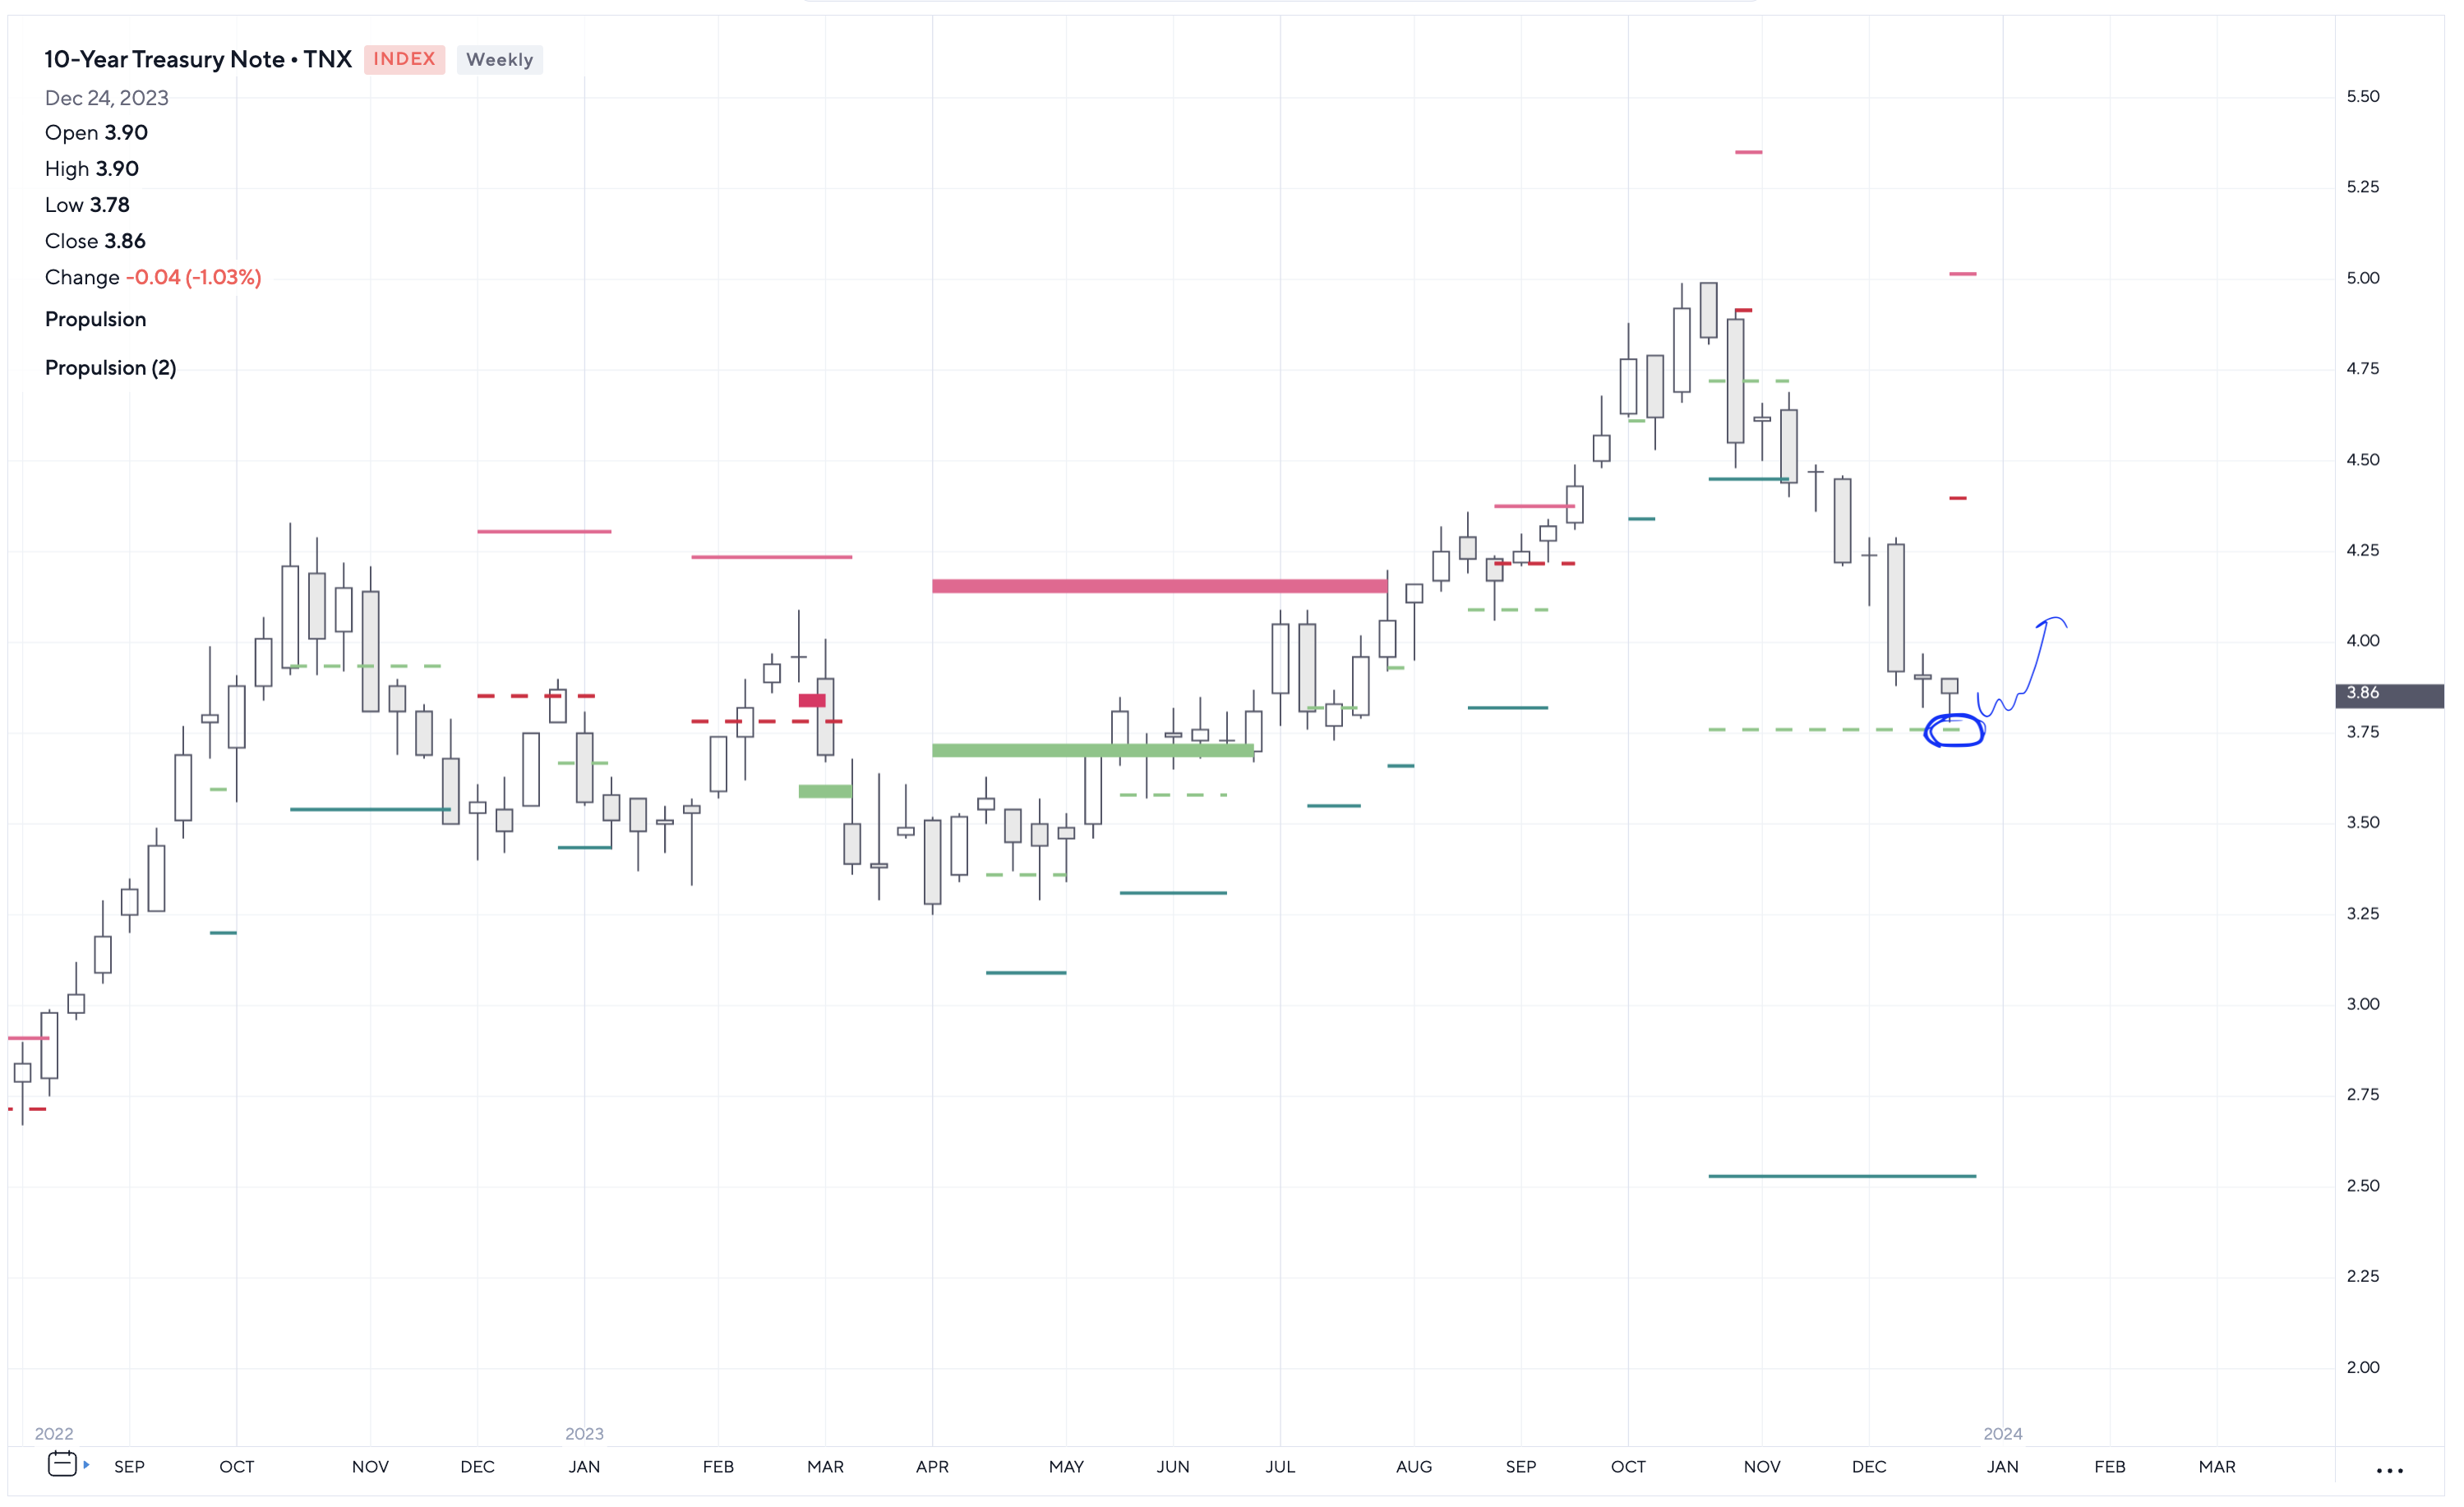
 From what I am seeing on the DeMARK charts for timing such a trade, we do seem to have some confluence here on the TD Propulsion support near 3.75% where we should see the market hold.