We recently pointed out high stock valuations typically lead to low subsequent returns over the long run, but the same does not apply over a shorter timeframe. The original post only examined subsequent stock returns over a 1-year and 10-year window, showing a much higher r-squared over the long run.
This led a client to question how the relationship looked at points in between these extremes. In other words, is there a sweet spot where the r-squared is high enough without needing to hold stocks for a 10-year period?
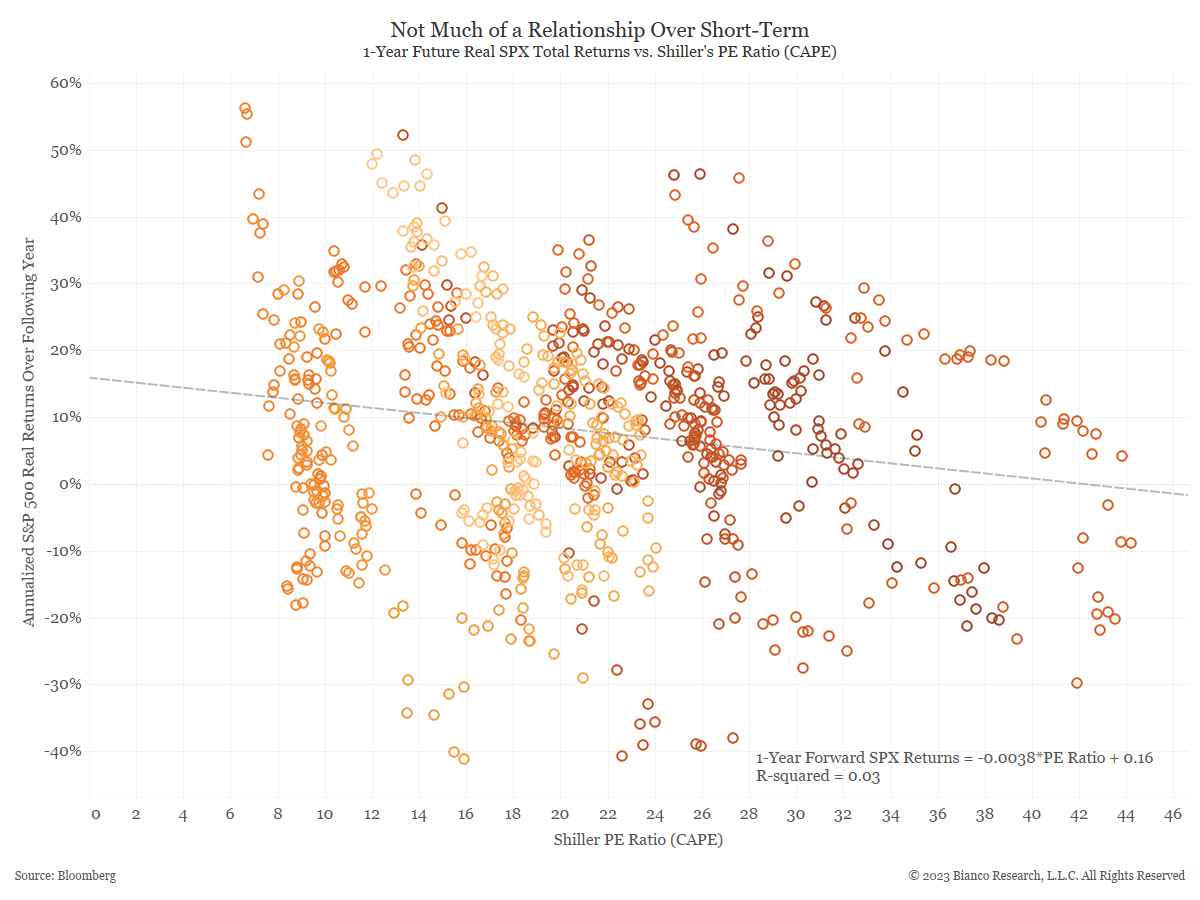
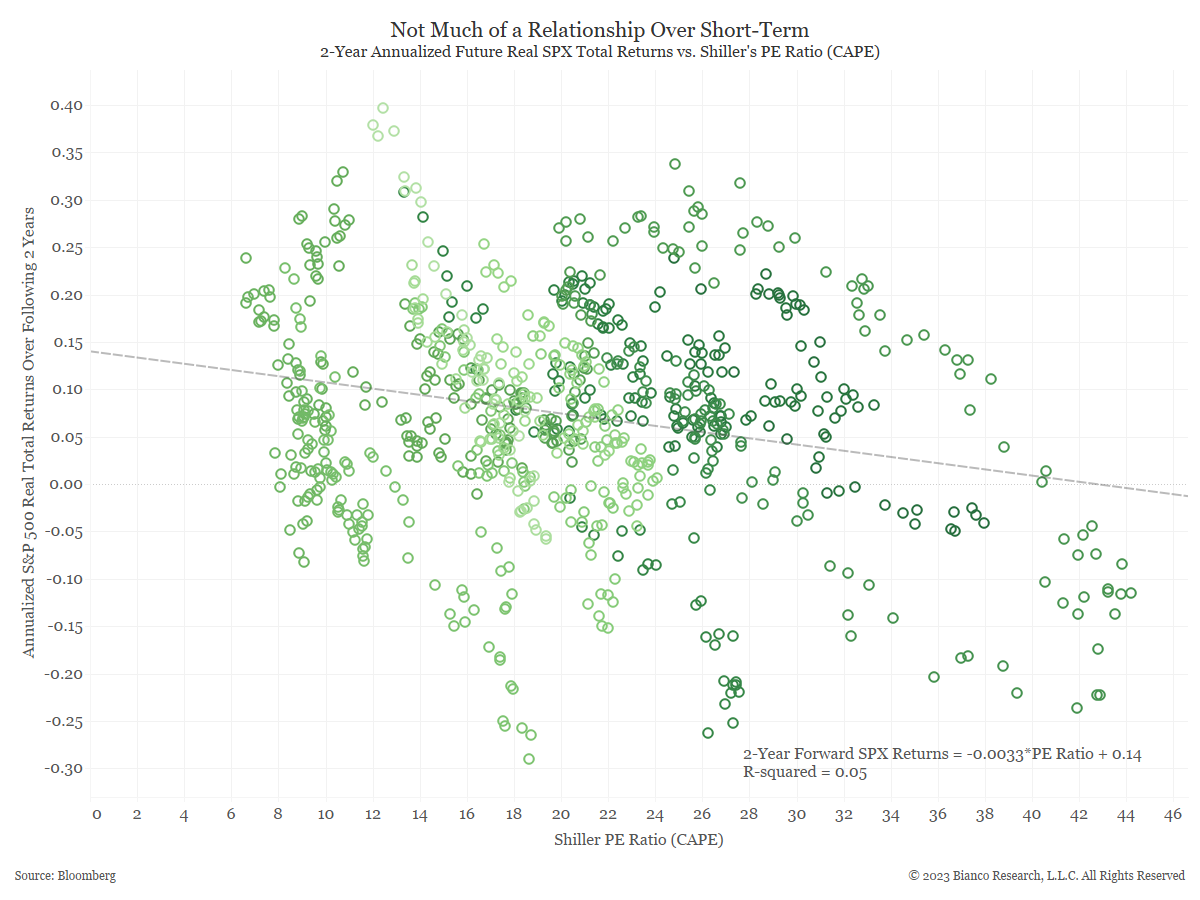
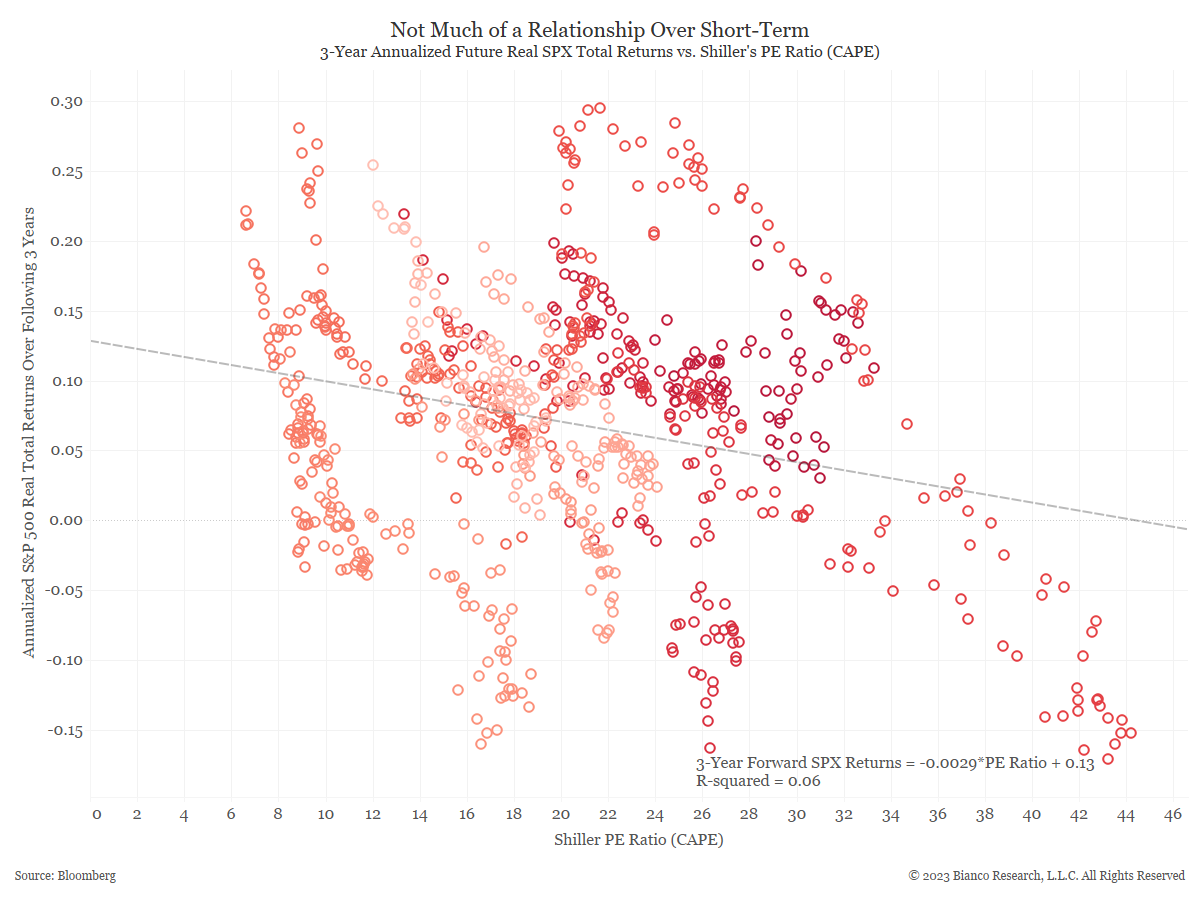
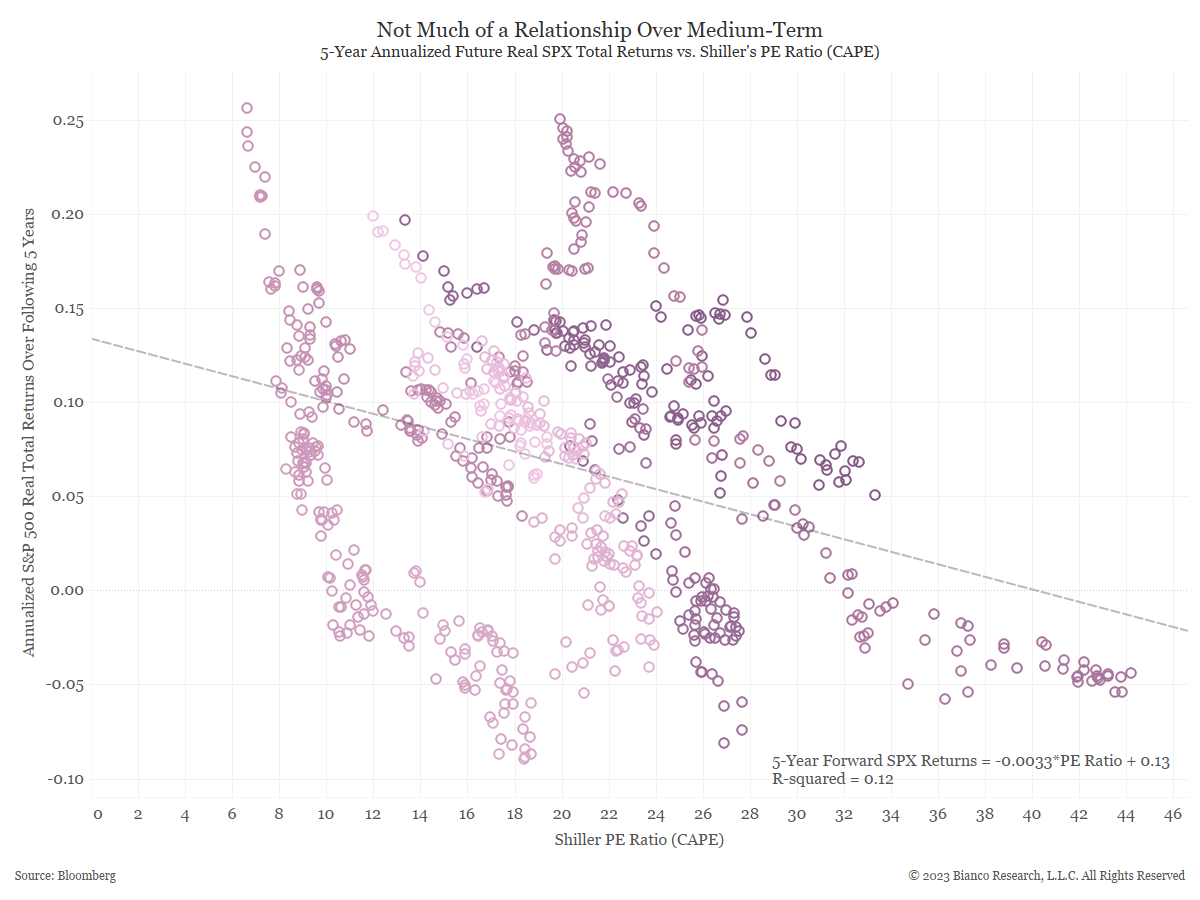
The charts below shows the relationship over several windows of time, with the following results:
- 1-year R2 = 0.03
- 2-year R2 = 0.05
- 3-year R2 = 0.06
- 5-year R2 = 0.12
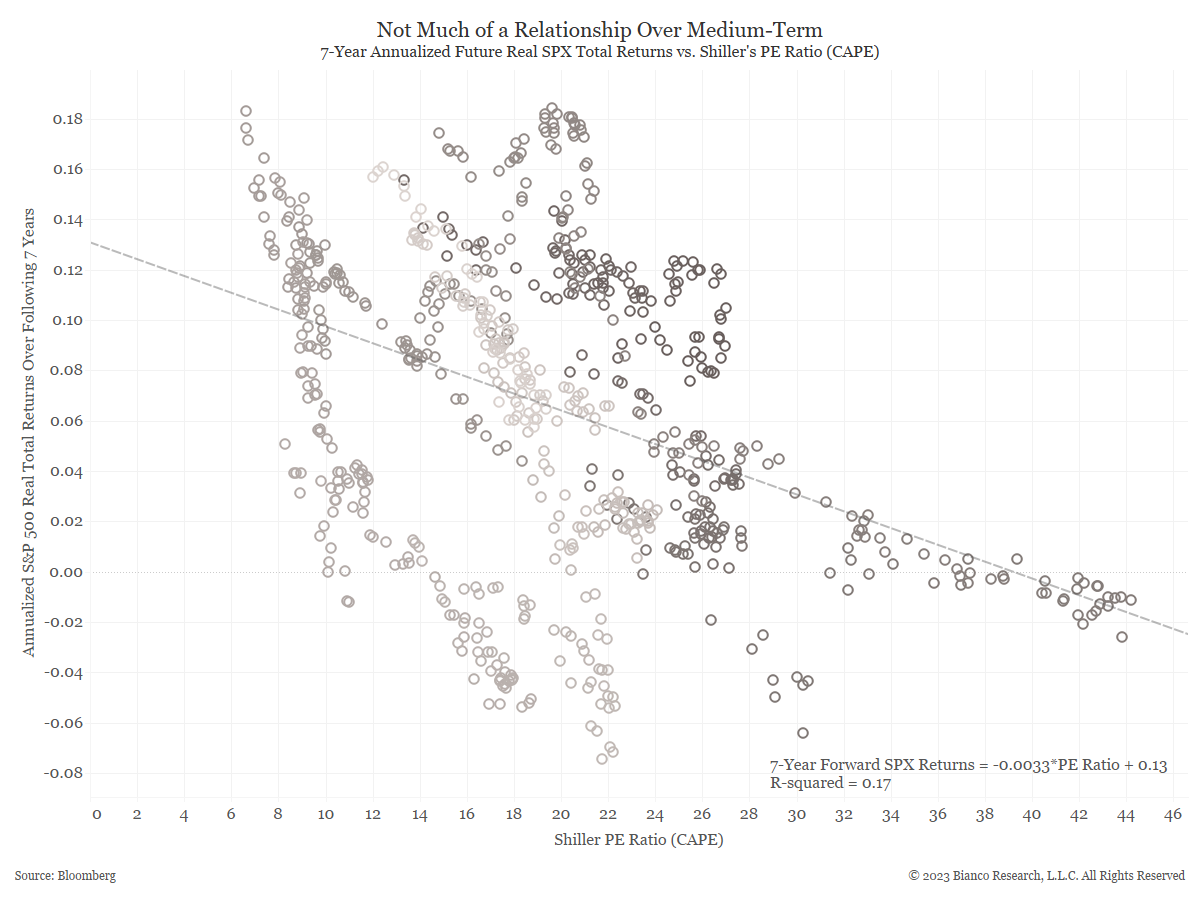
- 7-year R2 = 0.17
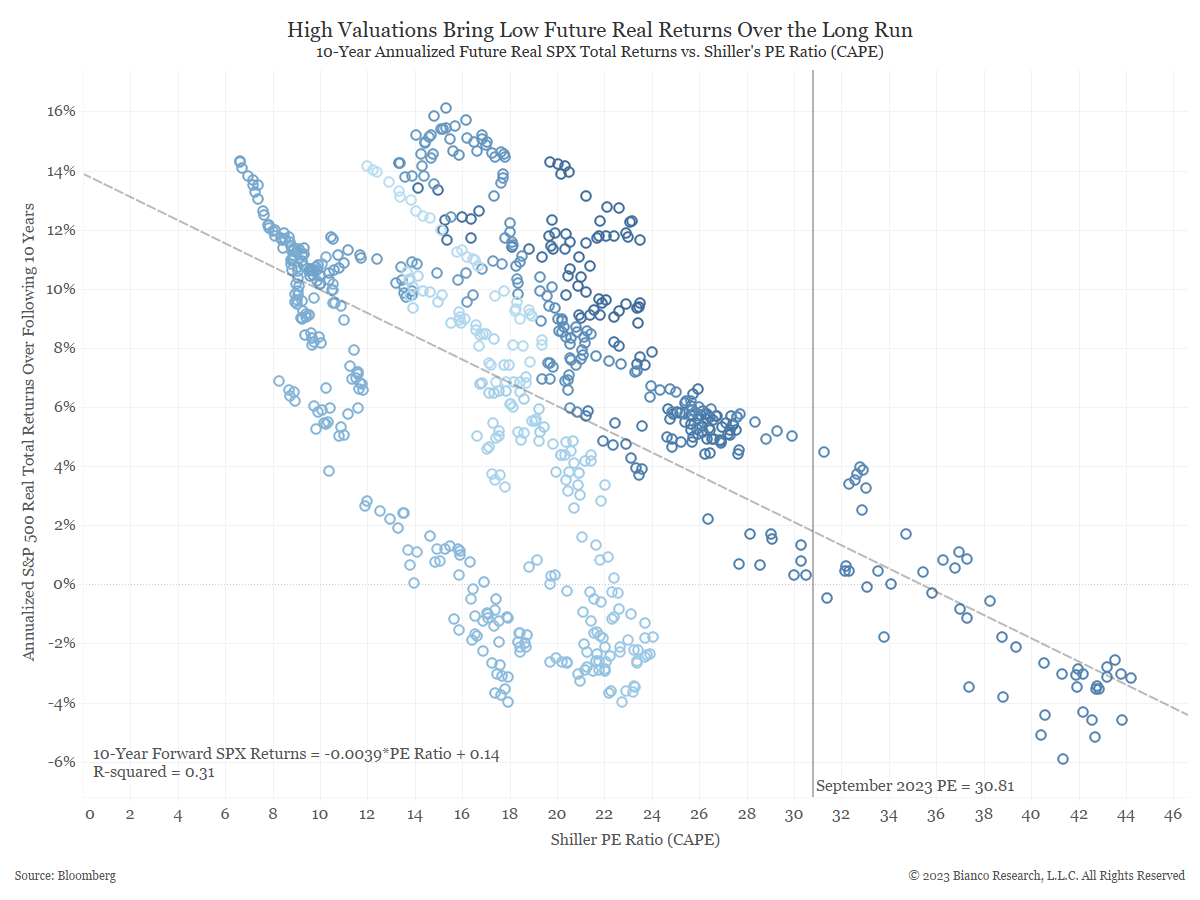
- 10-year R2 = 0.31
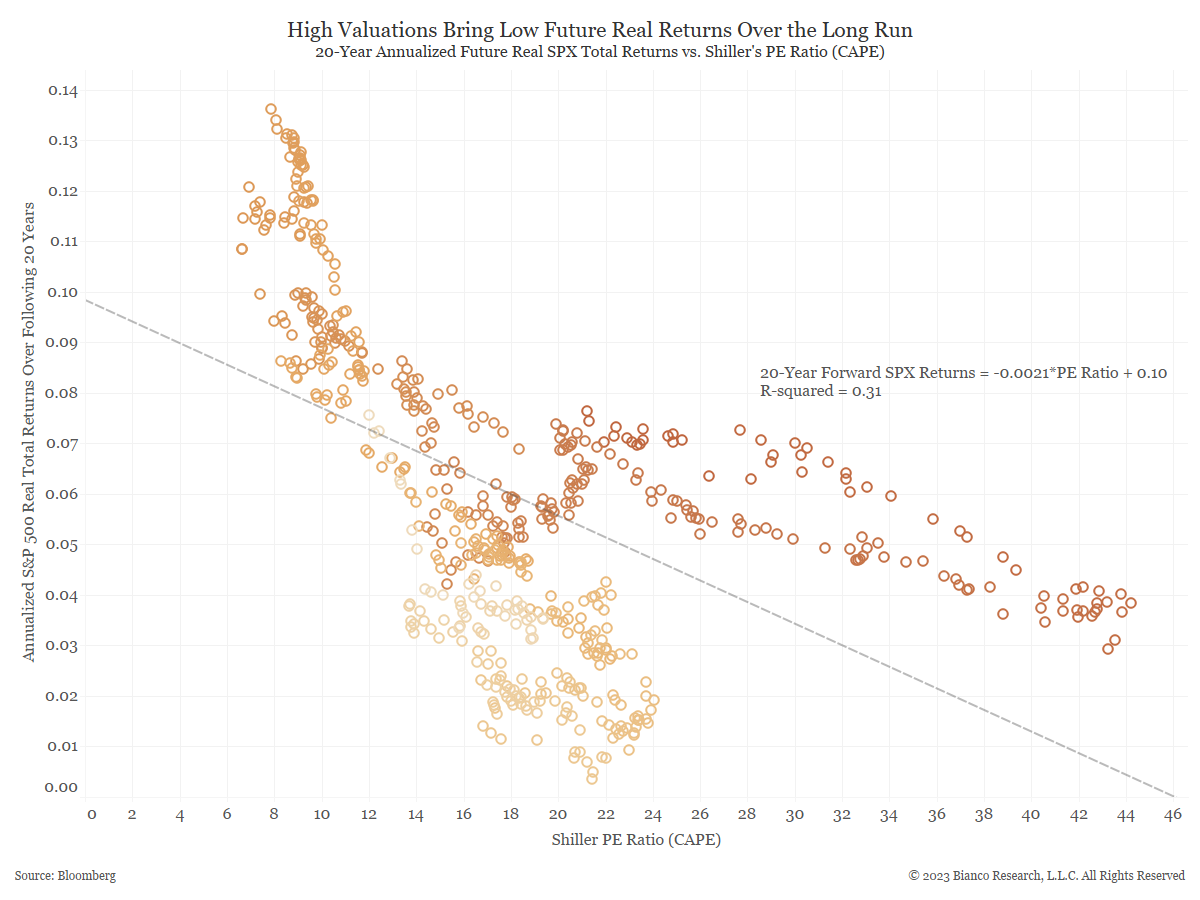
- 20-year R2 = 0.31
As might be expected, the R2 increases as time horizons lengthen. The R2 of a 7-year window is likely still too low to consider useful, whereas the 10-year window shows a much higher relationship. It is also worth noting that nothing additional is gained by holding stocks for a 20-year window rather than a 10-year window.