2023 began as a year of struggling fixed-income returns even after a disastrous 2022. The last FOMC rate hike was in July 2023 and the narrative has shifted from tighter policy to exactly when looser policy will arrive. Many expect the early months of 2024.
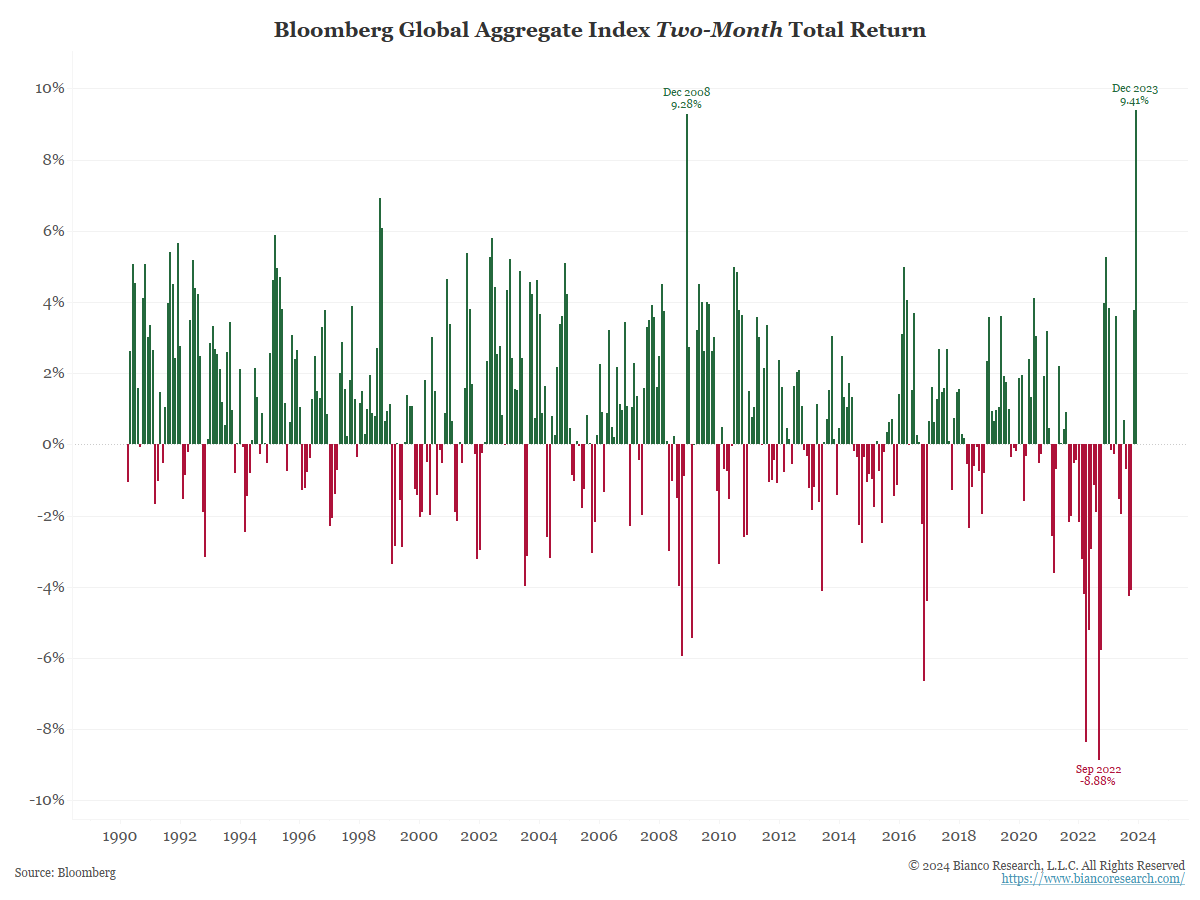
As the Federal Reserve’s pivot on rates becomes the base case for 2024, global bonds began to rally, posting the largest 2-month gain since this index began in 1990.
Inflation Sources
- 1793 to 1914 = Officer, L. H., and Williamson, S. H., 2020. “The Annual Consumer Price Index for the United States, 1774-2015”
- 1914 to present = Consumer Price Index (CPI) All-Urban
Stock Returns
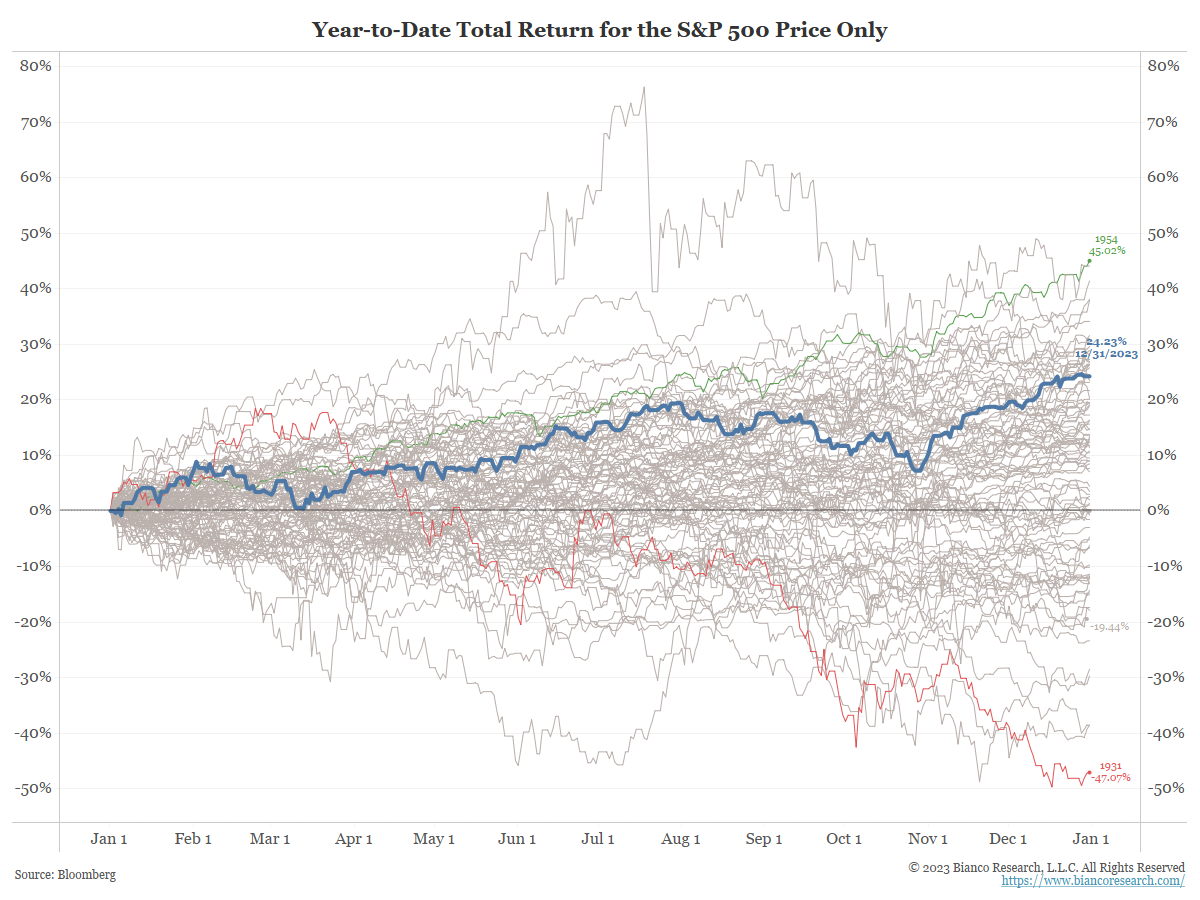
On a nominal basis, the S&P 500 Price Only Index ended the year up 24.23%. A big jump from 2022’s nearly 20% decline.
Bond Returns
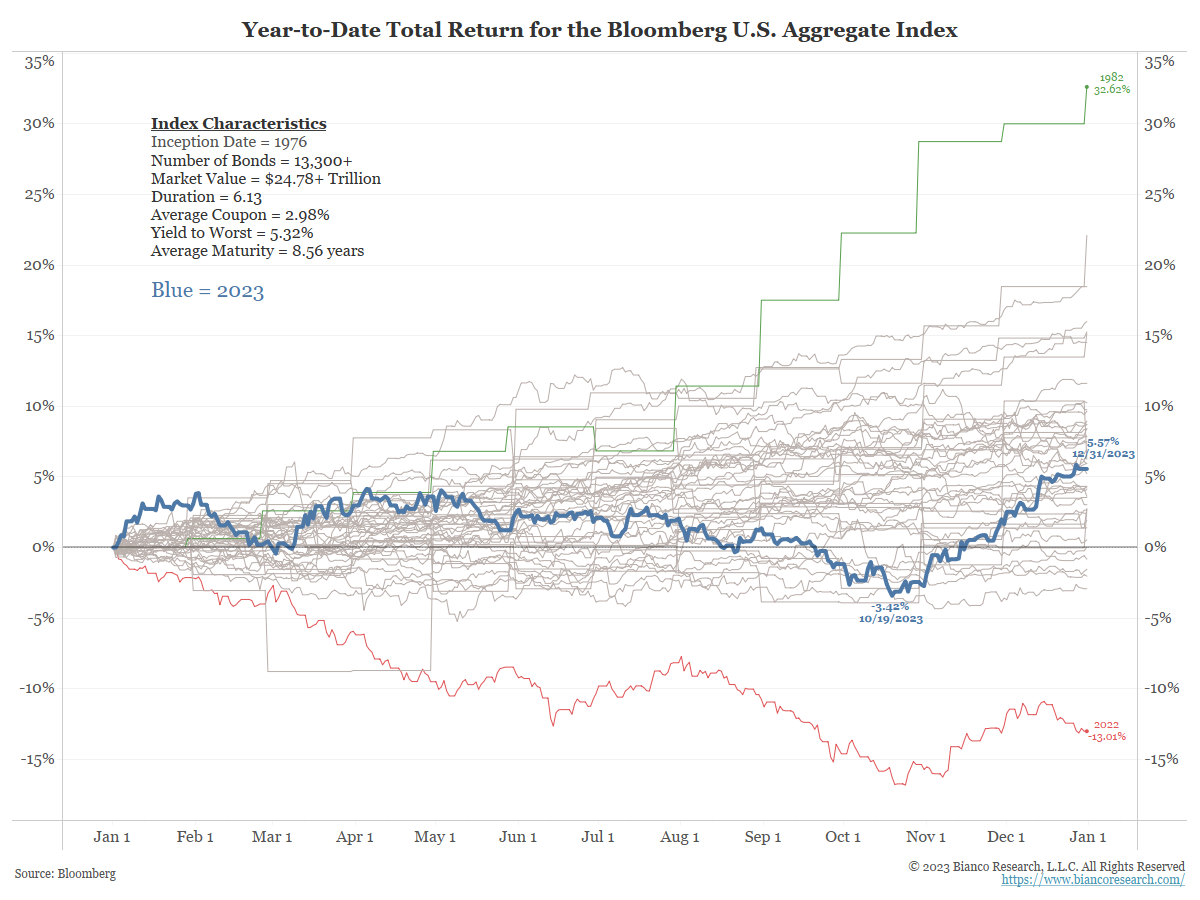
The bond market recorded an astounding rally to the end of 2023. The Bloomberg US Aggregate Index was up 5.57% on a total return basis after being down -3.42% on October 19, 2023.
The PDF below details total returns for almost every major asset class across the globe.
The charts and tables below put some historical perspective on the year. With some annual data going back to the 1700s, the list of sources is shown below:
Stock Sources
Bond Sources