ETFs represent an important part of equity markets, allowing everyday investors to capture different types of market strategies with just one investment and minimal fees. These are most often passive investments (allocators), yet active ETFs (traders) have become more common in recent years.
Allocator ETFs are used by investors who simply want to buy stocks for the long term. They are less concerned with liquidity and more concerned with cost. Additionally, they are often led by their advisors into certain funds.
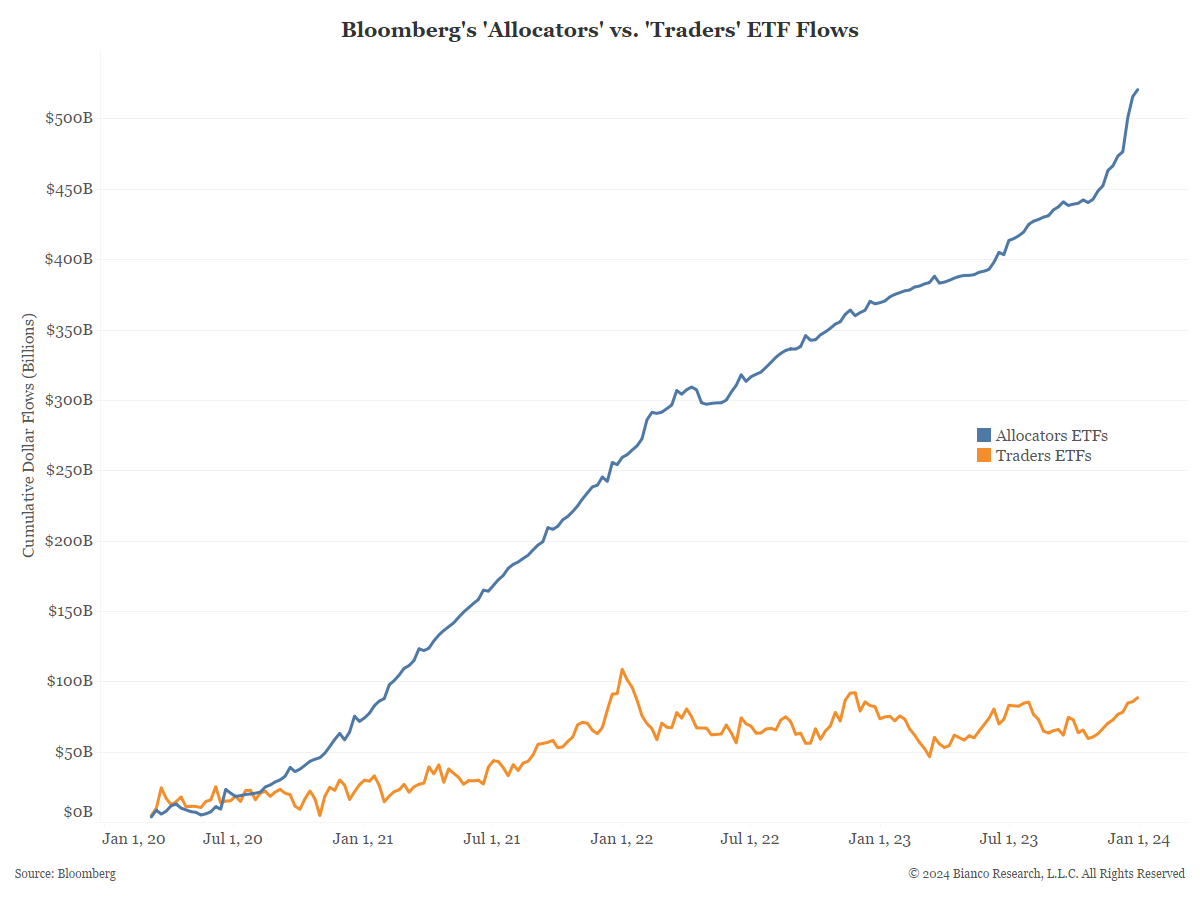
Traders, on the other hand, are more concerned with liquidity, so this group of ETFs consists of bigger funds such as SPY and QQQ. Their weekly flows, shown below, include both inflows and outflows regularly.
The first chart below shows allocator (blue) and trader (orange) flows in U.S.-focused stock ETFs. The trend of allocator inflows has continued through a volatile market.
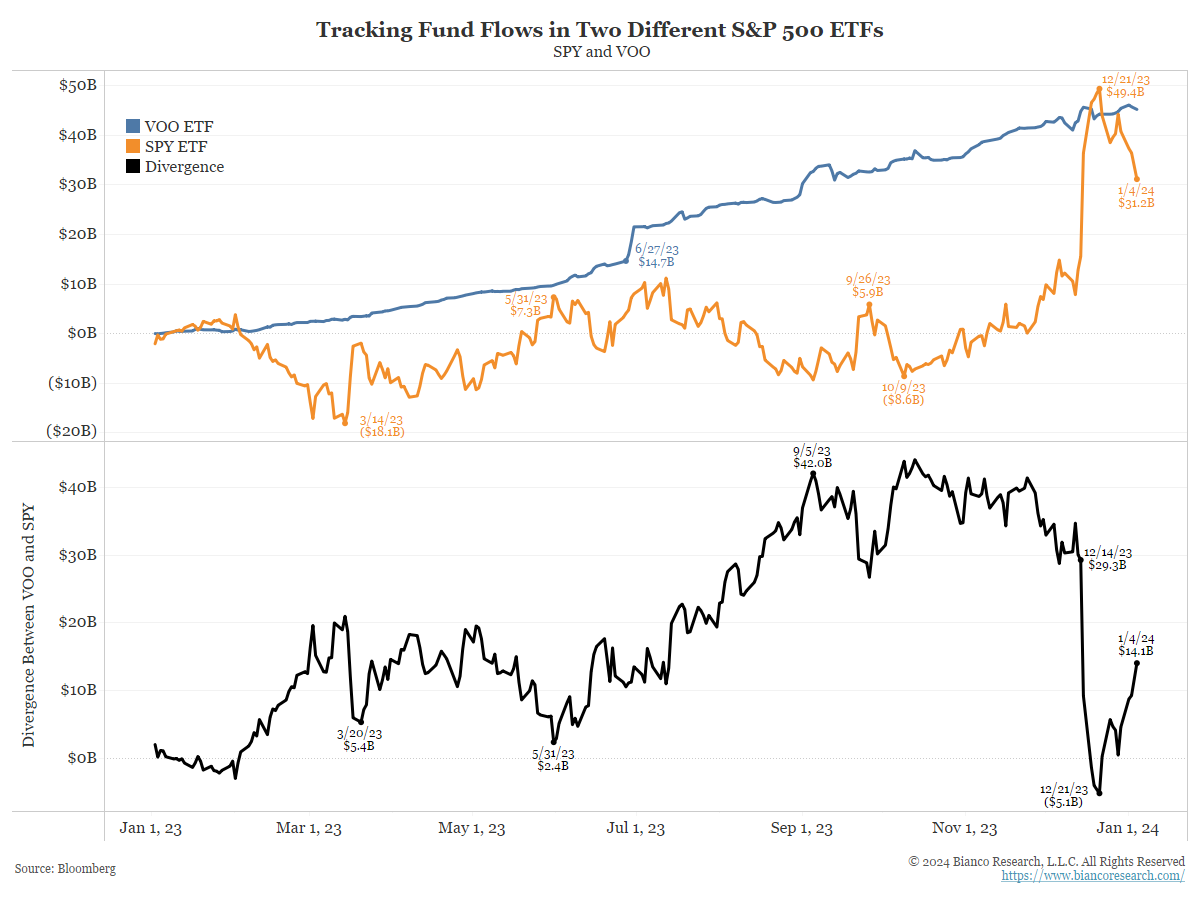
Allocator ETFs saw an acceleration of inflows into year-end as the equity market rally picked up steam. Even as SPY ETF saw massive inflows in December (second chart), trader ETFs have yet to break trend.
 The next chart details the flows of the biggest components of the ‘allocators’ and ‘traders’. Vanguard’s S&P 500 ETF (VOO) is the largest allocator ETF. The iShares S&P 500 ETF (SPY) is the largest trader ETF. Traders prefer the liquidity provided by SPY while allocators are more concerned with fees being as low as possible.
These funds are identical in holdings, yet flows reflect very different patterns based on their use. The bottom panel highlights this difference between the two funds. SPY had seen outflows until November when the fund saw a massive inflow as the index pushed near new highs. VOO, on the other hand, continues to show a steady pattern of inflows.


